If something came out of the events of the last two years, then it is definitely the power of digitalization. Almost all businesses have a digital presence nowadays. Whether you have an e-shop or an informative website, you need to analyze your digital performance to understand your customers and stay on top of their desires. But making data-driven decisions is difficult without the right analytics tool to help you out.
Luckily, there are many analytics platforms to choose from. According to Hotjar, the two most popular ones used today are Google Analytics (GA) and Adobe Analytics (AA). In this article, we will go through the key similarities and differences between them, so that you can figure out which tool suits your company best. Buckle up!
Introduction to Google Analytics
If you know only one web analytics platform, then it is probably Google Analytics. Like any web reporting tool, it allows you to track website traffic and user behavior. It is one of the most popular tools to monitor your website’s performance thanks to gathered data regarding customer behavior, engagement, and preferences.
However, did you know that there are two different versions of Google Analytics? Indeed, the one you probably know is the standard one: Google Analytics 4 (GA4), the successor of Universal Analytics. This version is free and targeted to help SMEs. The other version is called Google Analytics 360 (GA360). This is the premium, paid version of GA, aimed at larger companies. It is more comparable to Adobe Analytics since it has more advanced features and capacity than the standard version. To give you the most complete view, we will compare all three of them: GA4, GA360, and AA.
Introduction to Adobe Analytics
Adobe Analytics is a digital analytics solution that is often compared to Google Analytics, even though it is used more often in a large corporate context due to its advanced features and great power. Real-time multichannel data collection, website effectiveness measurement, and customer experience across devices are a few of Adobe Analytics' core capabilities.
Adobe Analytics also offers three different packages depending on your needs: Select, Prime, and Ultimate. However, the three packages are still considered as one solution, which is part of the Adobe Experience Cloud. The technologies in this suite give users the ability to use precise segmentation and real-time data across many marketing channels – slightly comparable to the Google Marketing Platform. All of this is made possible through the use of machine learning and artificial intelligence.
Adobe Analytics vs. Google Analytics 4 vs. Google Analytics 360
The most important difference between Google Analytics and Adobe Analytics is that Adobe Analytics is an actual web analytics tool, while Google Analytics is more appropriate for web reporting. Let’s dig deeper into the technical part.
(Note: I will be using the term GA for both GA4 and GA360 when there are no significant differences between the two versions)
1. Website Traffic
Obviously, the purpose of these tools is to analyze website traffic data. Both Google and Adobe Analytics are great at providing details of channels that bring this traffic. They also give you all the information you need to start enhancing customer experience, by providing key metrics such as detailed user behavior, acquisition, and bounce rate. GA allows you to examine the traffic from your paid and organic advertising campaigns, while AA also supports multichannel data collection and data processing.
Winner: In terms of website traffic reporting, both technologies are comparable and excellent.
2. User Friendliness
GA’s user interface is quite intuitive and straightforward. By just navigating through the few menu options, you may already tell which kind of insights you will get. Each menu is again subdivided into smaller parts, which makes it easy to look into a particular report type and get the desired insights.
Although AA works with a clean drag-and-drop interface and flexible tables, its highly customizable layout from business to business can make it a bit complex. Getting the necessary insights and data from AA requires a thorough understanding of how the data is being captured and reported. Without the right training, using AA might be tricky for novice users.
Even the terminology used by the two solutions can make a difference. While a user may quite easily find what they need in GA by browsing around with intuitive categories, it can be hard to figure out ‘custom eVars’ and ‘sProps’ if you do not have expert knowledge of an AA implementation.
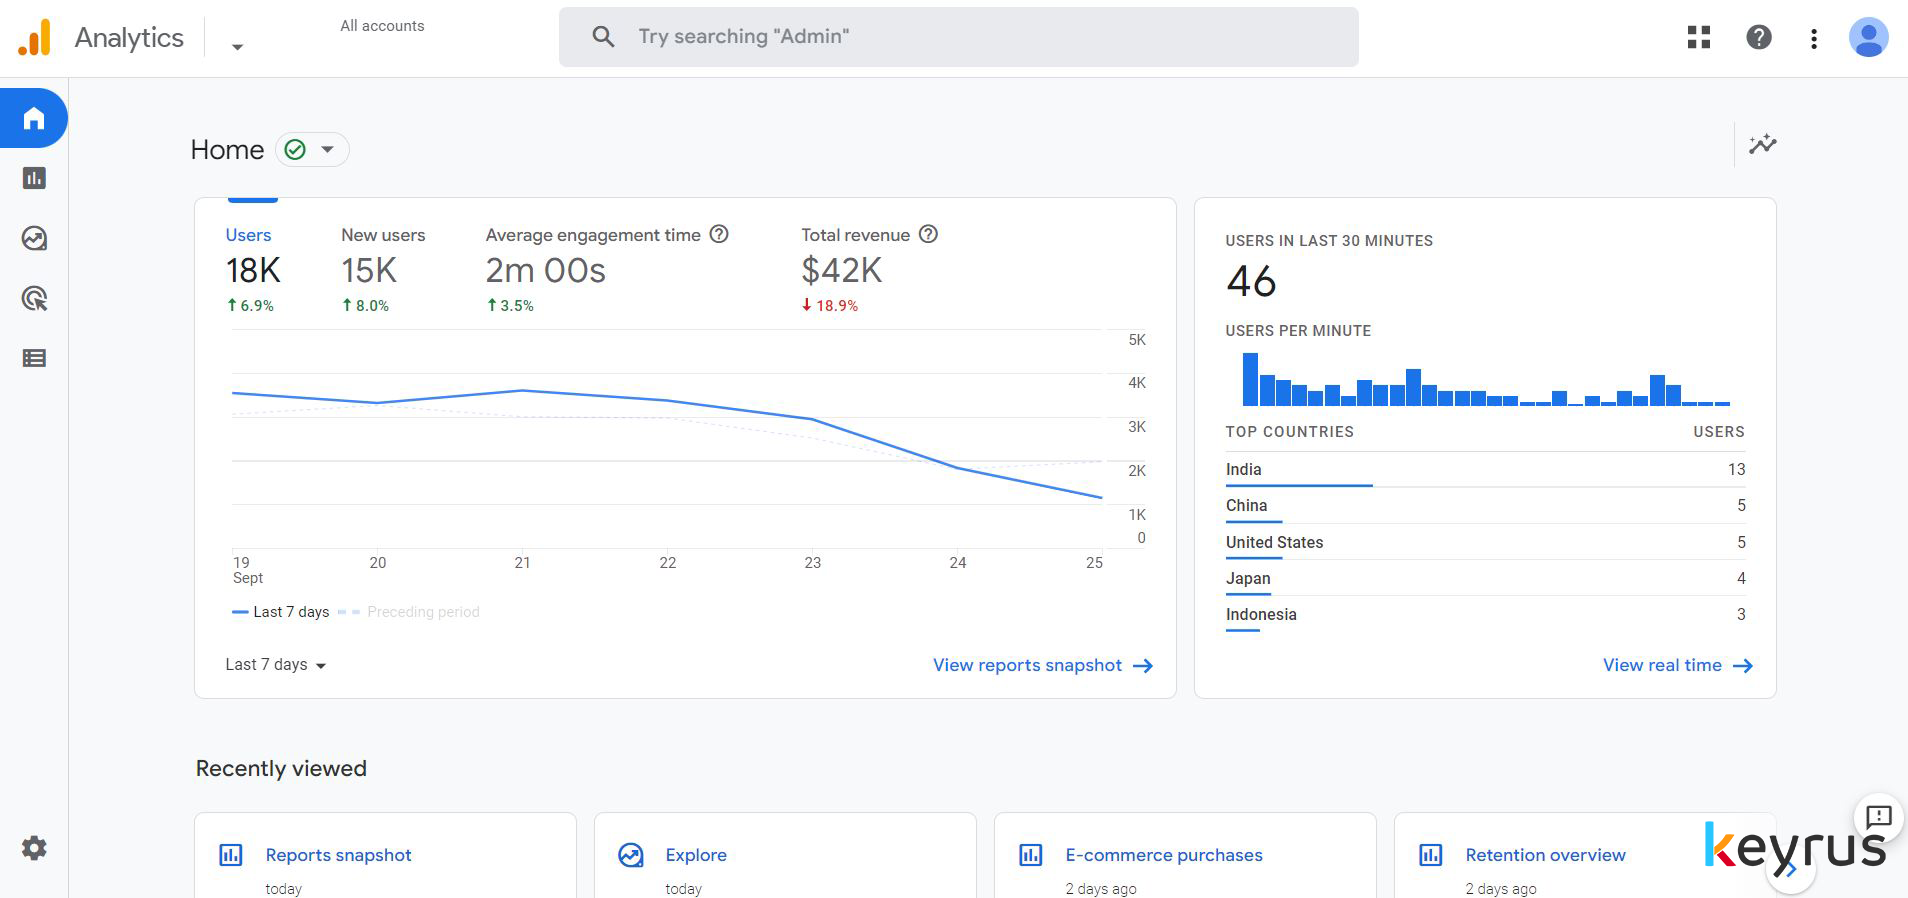
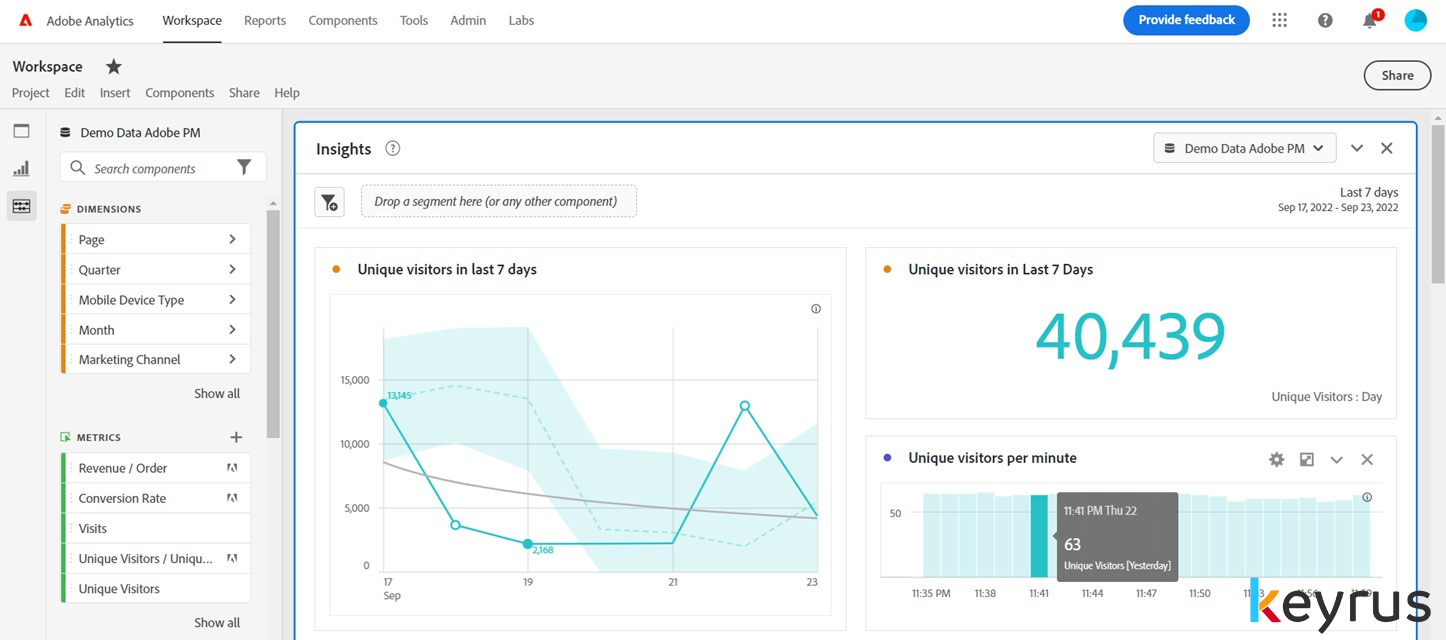
GA’s interface vs. AA’s interface
Winner: Because of its intuitive and easy-to-use interface, GA has more advantages here, especially for basic/novice users. For power users, the solutions are closer to even.
3. Implementation
GA standard tracking is done through a JavaScript snippet to be added directly to the HTML of each page on your site, or indirectly using a tag management system (TMS) such as Google Tag Manager. This makes the implementation process simple and convenient. Detailed documentation on how to implement ecommerce tracking, cross-domain tracking, events tracking, etc. can be found on the Google Analytics Help Center.
AA is relatively harder to implement and requires programming expertise and professional support. Even though comprehensive documentation can be accessed on the Adobe Experience League, it is advisable to have it installed by experts. AA recommends using Adobe Launch (Adobe’s TMS) for implementation. You could also use other enterprise-level TMS, but this does not make it easier. In contrast to the GA tag, which collects all fundamental metrics and dimensions, you must pass all website performance KPIs using custom variables in AA.
Winner: Because Google Analytics is so simple to implement, it is the winner of this category.
4. Attribution Model
The purpose of the attribution model is to assign a value to each touchpoint along the customer's conversion journey. For instance, a buyer might learn about your products on social media before eventually purchasing them directly from your website.
Multi-channel funnels are available in GA to identify and monitor these conversion paths, although some functions are exclusive to GA360 (for instance the ROI analysis). You may integrate online and offline behavior and attribute it to specific individuals to get a comprehensive view of the user journey across all devices and platforms. GA offers six different attribution models, which you can compare against the marketing channels using the ‘Model Comparison’ view.

GA’s attribution models
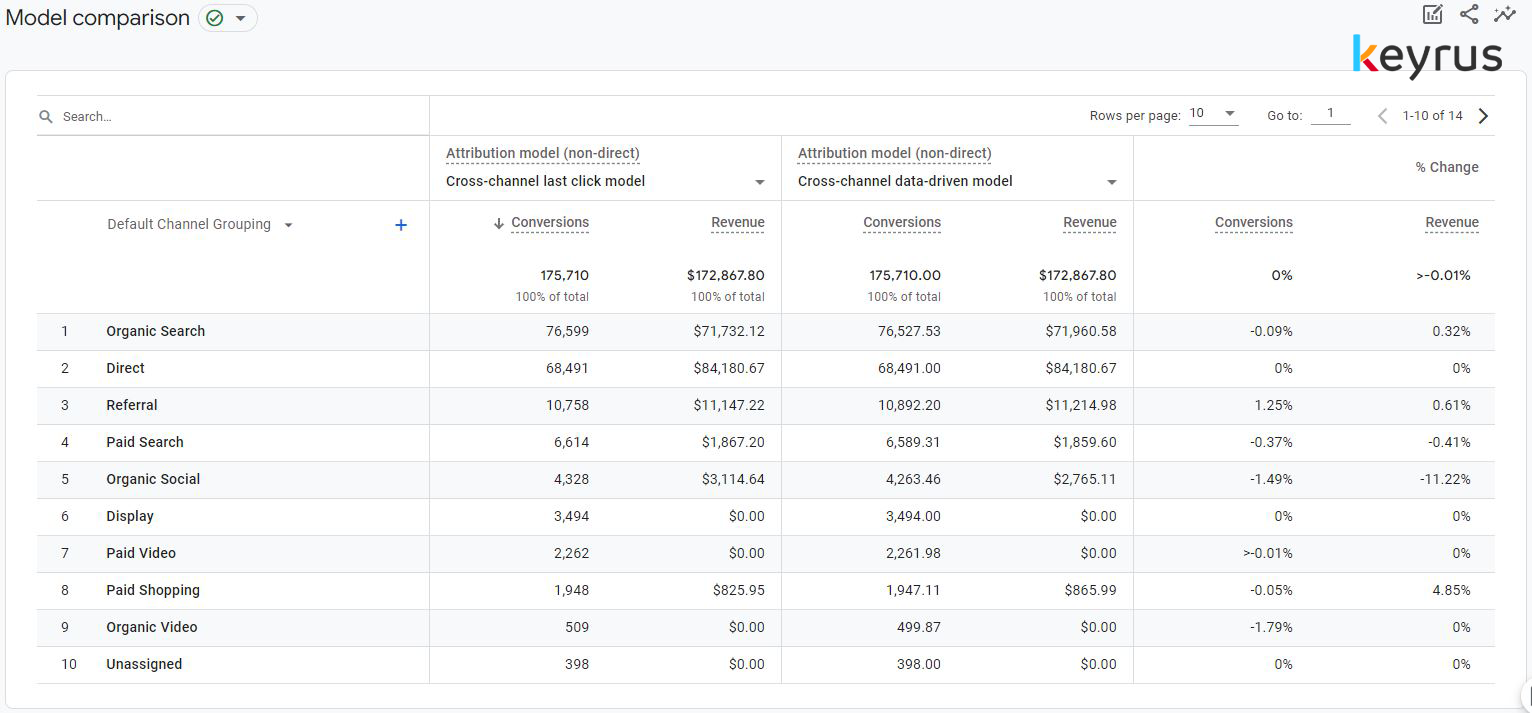
GA’s model comparison view along with marketing channels
AA offers nine attribution models and a customizable one. The Attribution IQ feature also allows deeper analysis with calculated metrics. These allow you to compare attribution models, for example by subtracting First Touch from Last Touch. You can also create hybrid models - for example, 50% Time Decay plus 50% First Touch - or apply attribution to your important conversion metrics such as revenue per orders, or orders per visit.

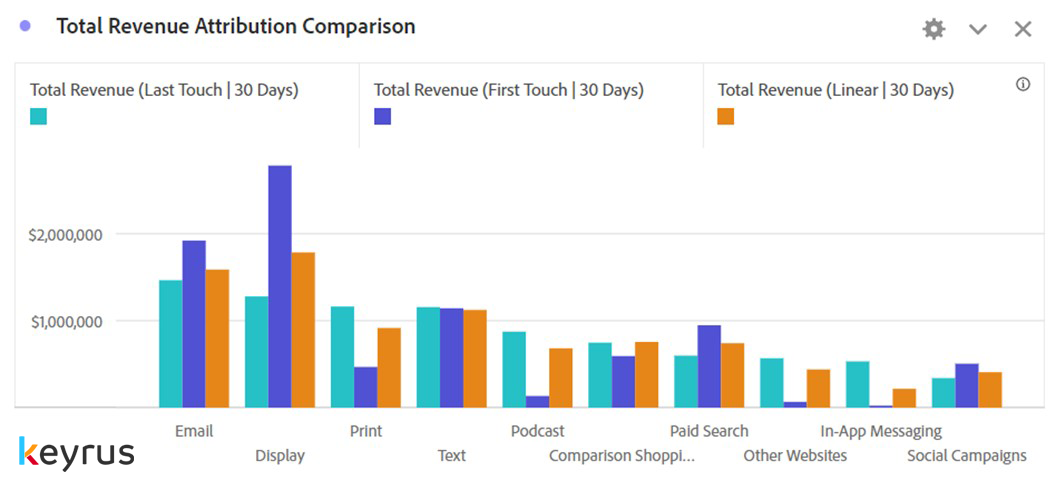
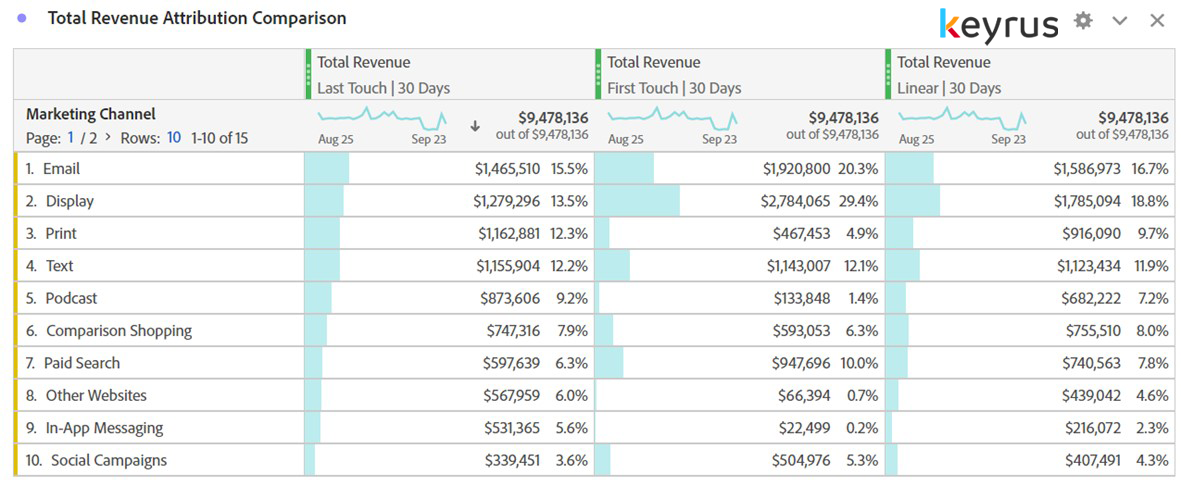
AA’s model comparison view along with marketing channels
Winner: This is almost a tie. Although GA makes it easier to include offline behavior, there is no denying that AA’s options are really advanced. They make it easy to get a quick, clear overview. Therefore, we would declare AA as the winner here.
5. Report Building
GA has some excellent pre-configured reports that are ready to use right out of the box for tracking website performance, acquisition patterns, engagement, and so on. You do not have to create any report or add metrics/dimensions to view general website performance. However, GA reports are not interactive, meaning that if you share reports, they will not have the liberty to analyze in depth. It is advised to use Data Studio (Google's reporting and visualization tool) if you would like entire website performance and user activity statistics at a glance.
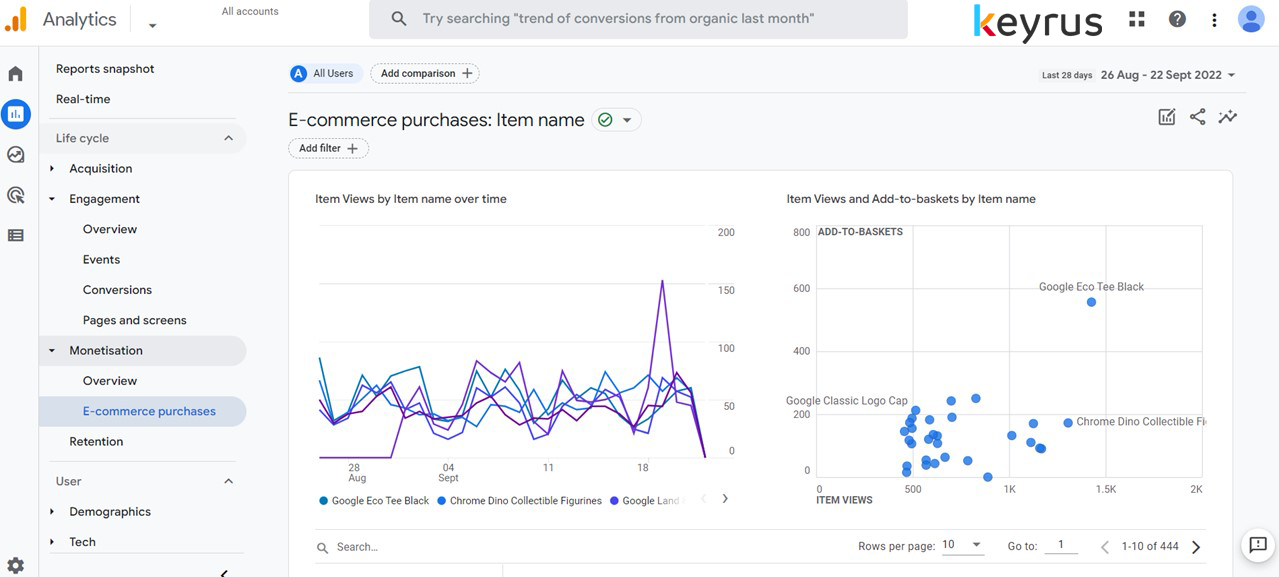
GA’s reports snapshot and reports menu
Adobe offers its own set of tools for advanced reporting and visualization within AA itself, which allows you to build your customized report. Building segments and creating calculated metrics can be done in a blink of an eye. As noted earlier, this illustrates the fact that AA is a complete analytics tool while GA is more of a reporting tool. Adobe combines predictive algorithms, built-in statistics, and the machine learning of Adobe Sensei (artificial intelligence tool) to make data science features accessible to analysts and marketers. Besides, the drag-and-drop functionality and plugin tool for MS Excel data make information sharing more practical. As a result, companies can share their reports without granting back-end access. However, although these tools are very handy to use, you still need some knowledge and skills to get the most out of it. The implementation can be a little challenging, but when done correctly, it produces a ton of business-worthy reports that can help you make important decisions.
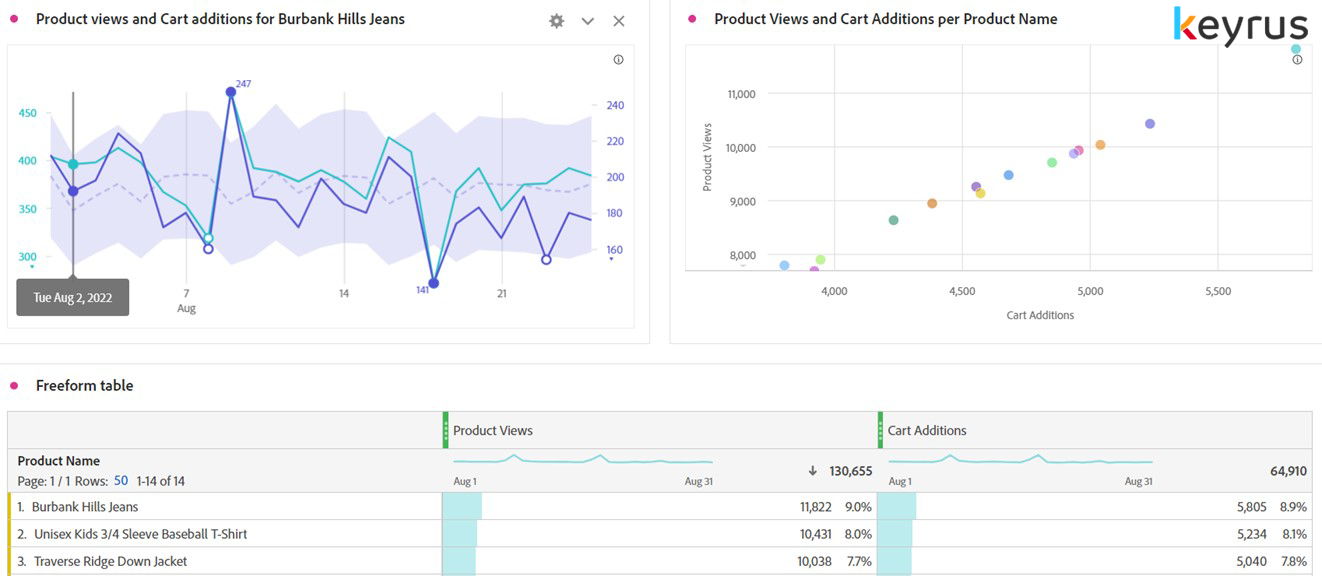
AA’s reporting possibilities
Winner: since both GA and AA provide pre-built reports, the advantage goes to AA for its extremely powerful capabilities and sharing features all within AA itself - without having to use another tool such as Data Studio.
6. Pathing & Funnel Analysis
Thanks to the “Flow charts” feature, AA pathing analysis is impeccable and entirely out of the box. The visualization is so straightforward and simple that you will get the most insight out of it. By choosing a page or event, the report will show you what users did before and after. Simply click on any of the path's touchpoints to get further detailed information.

AA’s pathing analysis
GA finally launched similar pathing options in its latest version, but it is still not as fluent as AA’s pathing analysis. Additionally, it is not possible to use custom dimensions in path reports.
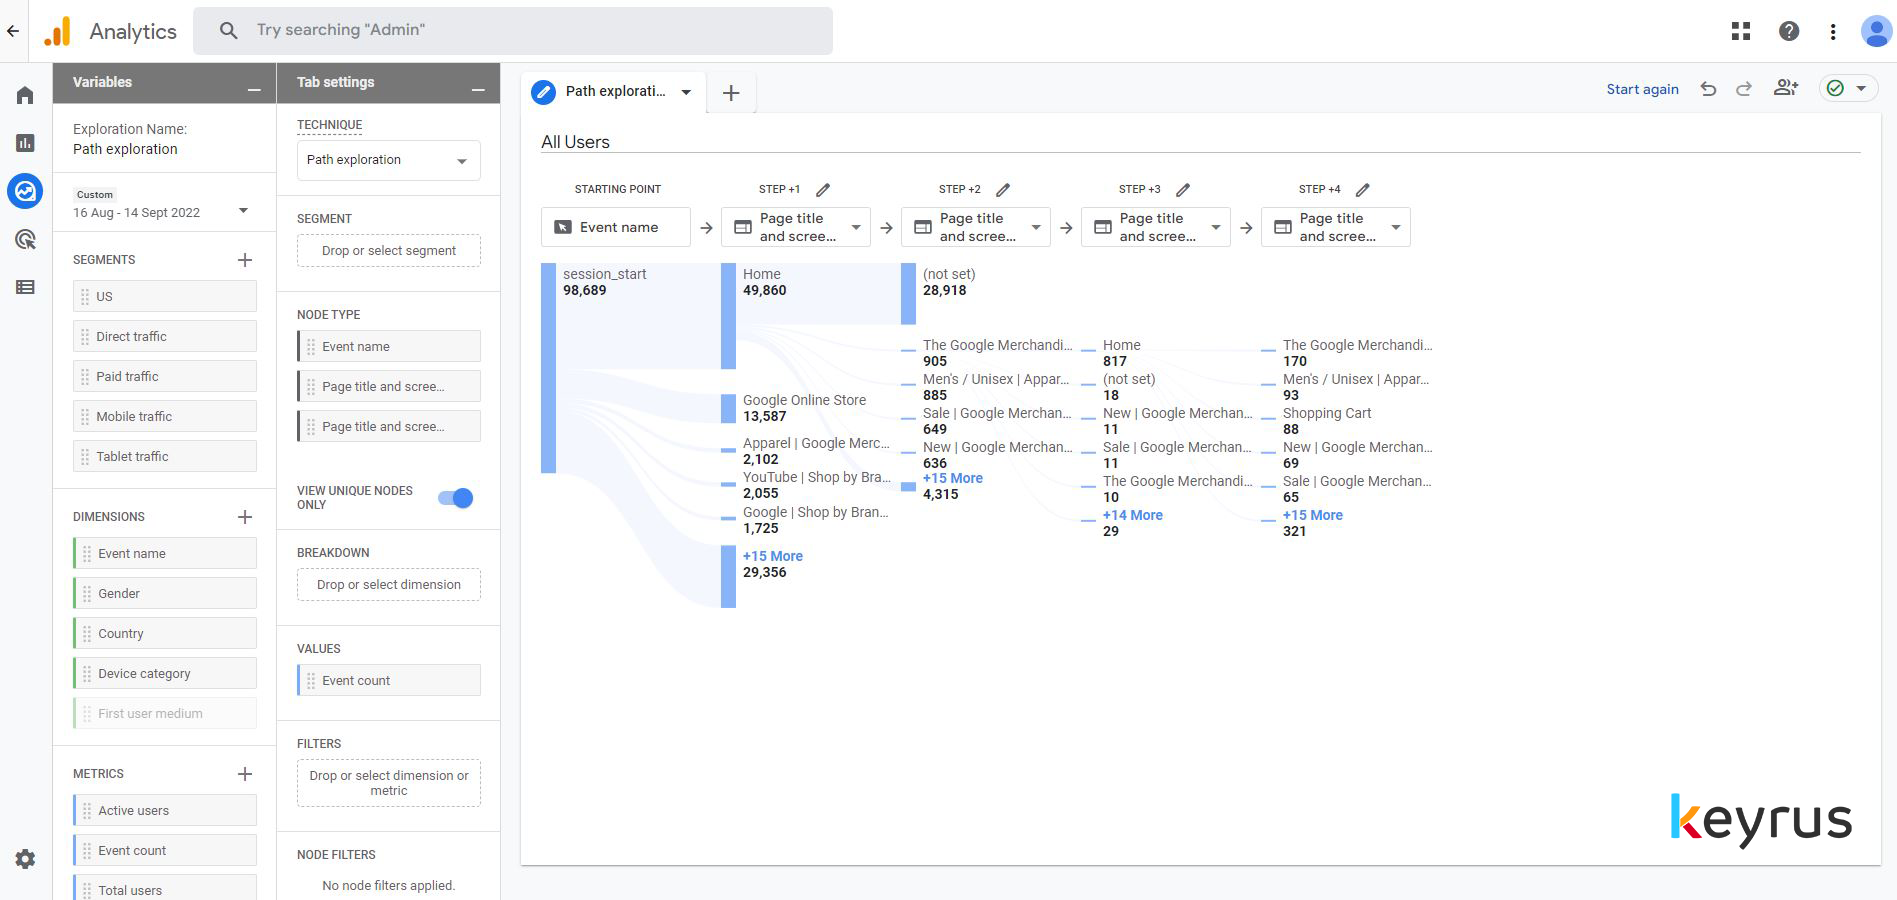
GA’s pathing analysis
Making a custom funnel in GA does allow you to view drop-offs, but it has limitations because it does not allow you to see users' free flow.
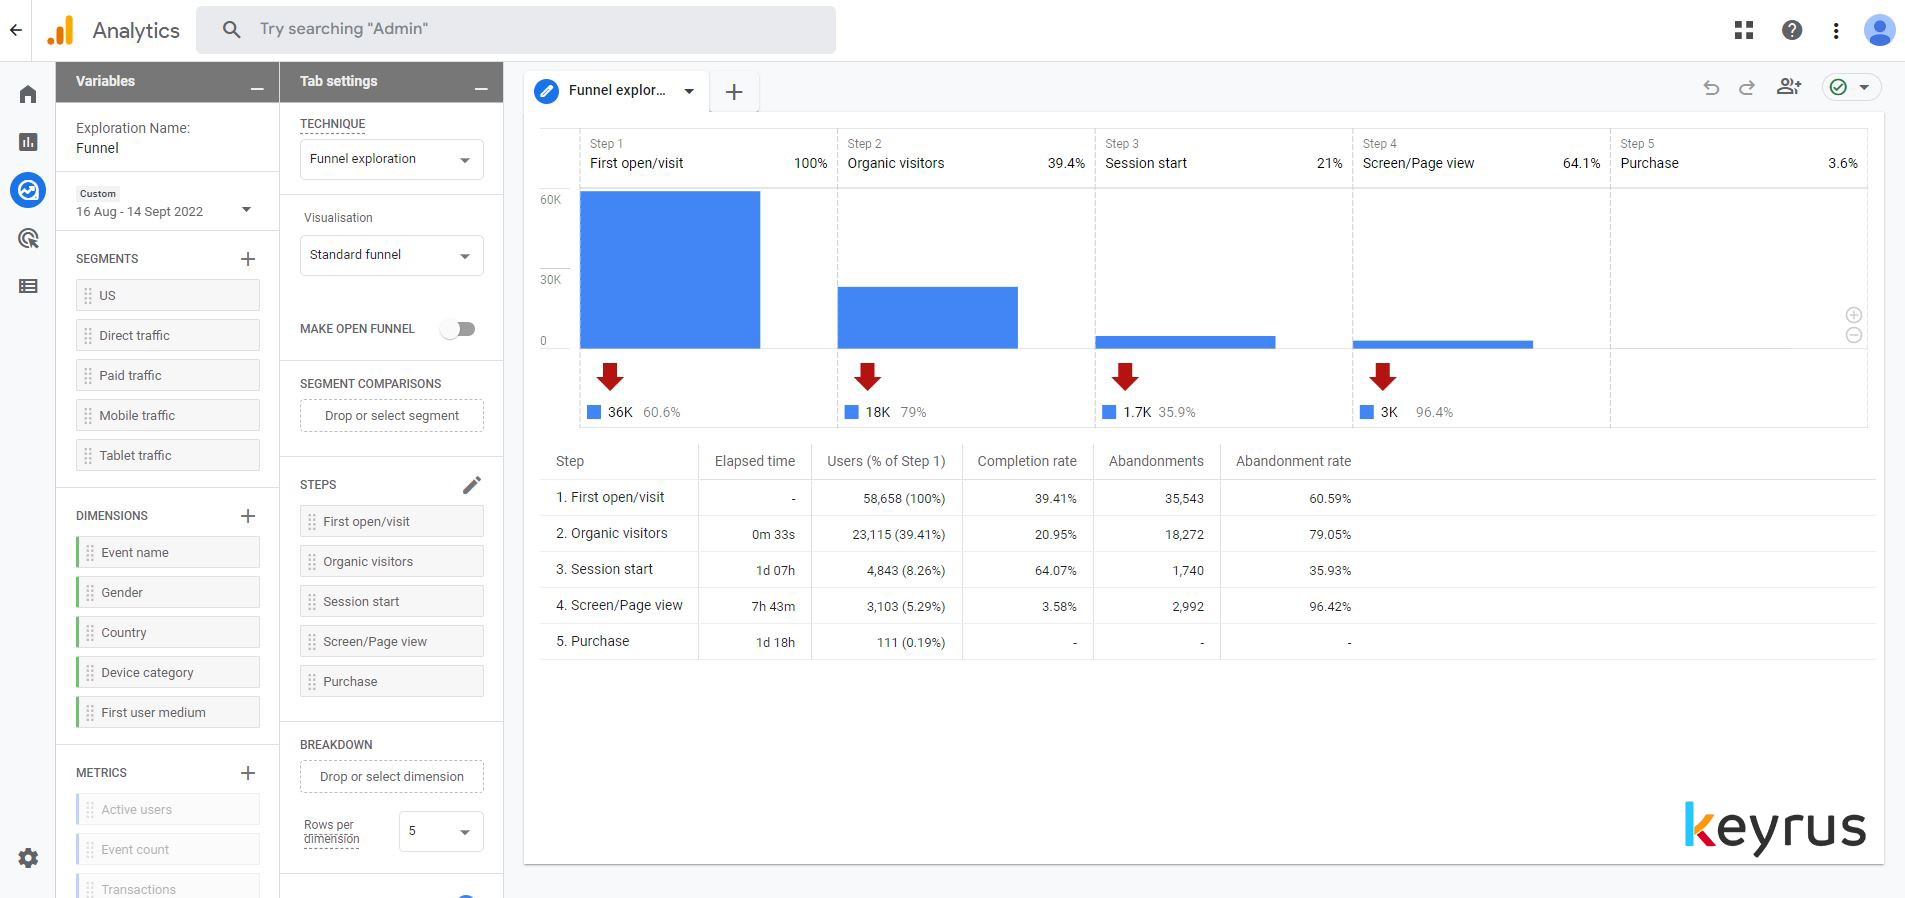
GA’s funnel analysis
The fallout chart in AA - comparable to GA’s funnel - can be customized way further through eventual paths and custom dimensions/metrics/segments.
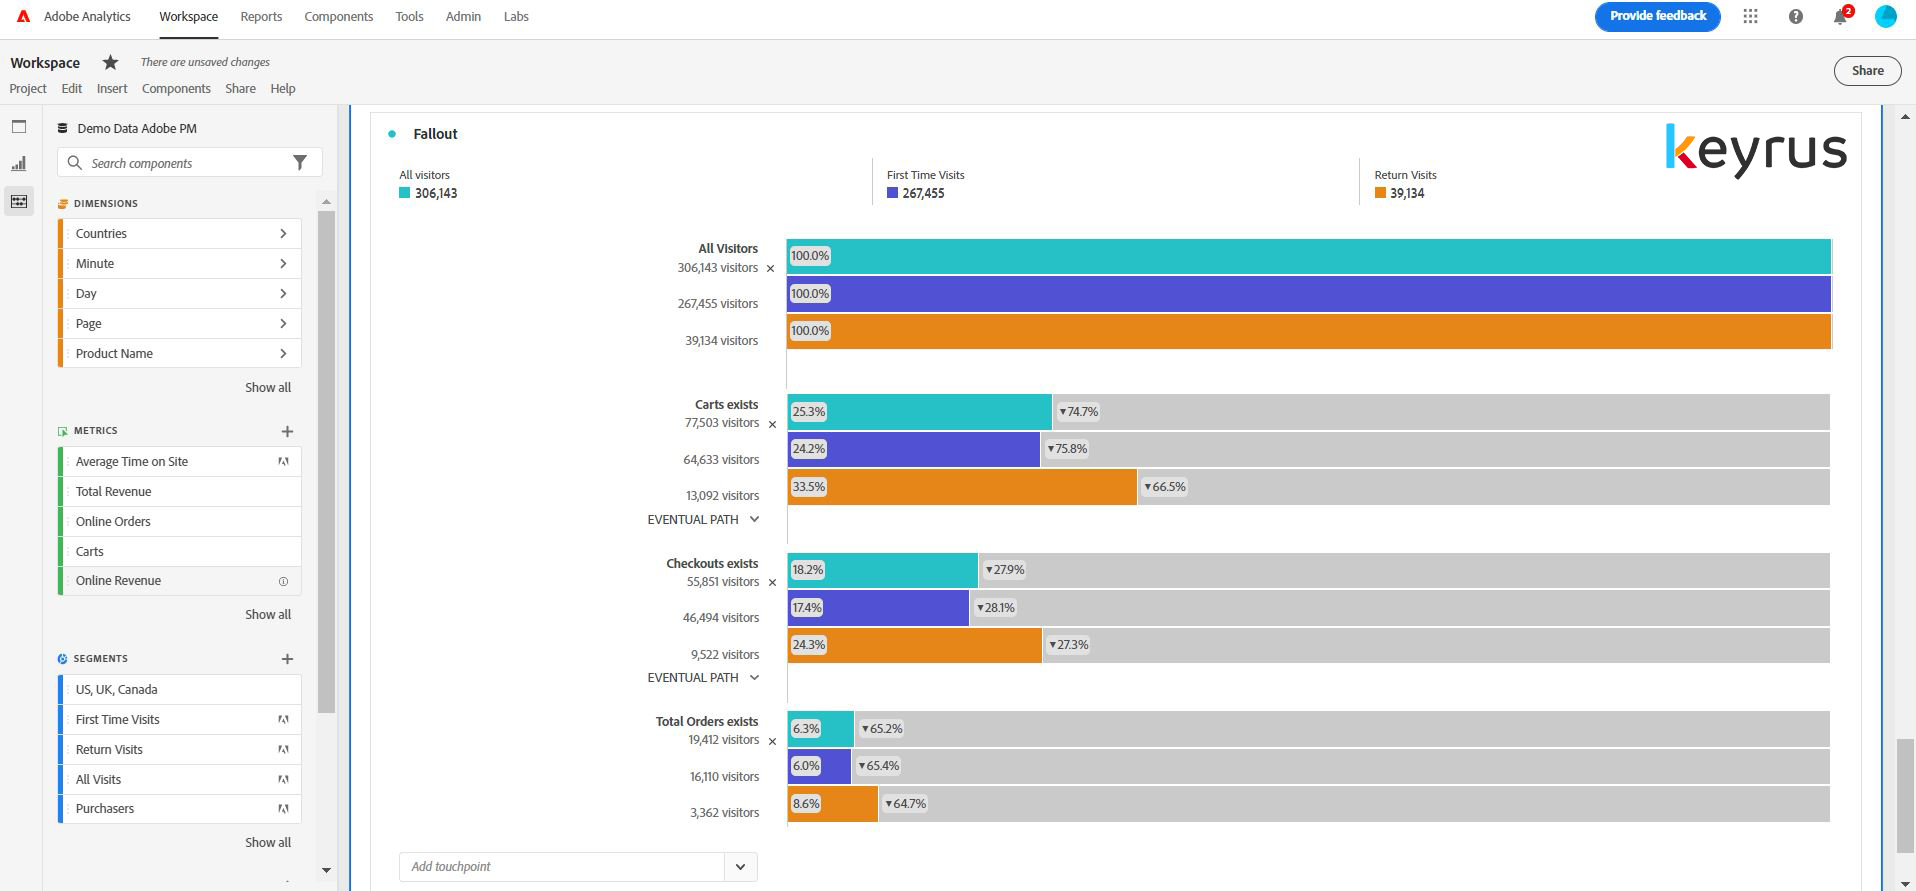
AA’s fallout analysis
Winner: When it comes to pathing and funnel/fallout analysis, AA is definitely more sophisticated. You can quickly create a custom path and view all the information you need.
7. Custom dimensions and metrics
A powerful way for sending custom data to GA is through custom dimensions and metrics. These custom dimensions have a scope of hit, product, session, or user, while the custom metrics have values like time, currency, and numbers. Each website can have a maximum of 200 custom dimensions and 200 custom metrics in GA360. On the other hand, GA4 only has a maximum of 20 of each. Additionally, the possibility of using BigQuery for cloud computing adds customization possibilities for quick and efficient analysis.
The hit level dimension in GA is comparable to the "Traffic Variable" (props) that AA offers. AA’s "Conversion Variable" (eVars) can have a scope of either hit, product, session, or user. AA offers 100 to 250 eVars, 75 props, and 1000 events. The customization choices are practically endless thanks to the ability to use eVars, sProps, and success events for data capture. AA also offers a system comparable to GA with Adobe Data Warehouse, although it is slightly more limited than BigQuery.
Winner: There is no winner here, as it all depends on how many business KPIs you want to track. Any enterprise-level analytics tool should allow you to customize it to match your specific needs and address your business problems. Both GA and AA offer great customization choices, making them both flexible enough for different tracking needs.
8. Pricing
GA4 is free, making it the best option for many SMEs - although it has a limit of 10 million hits per month. GA360, on the other hand, is a premium paid service that usually starts at $150,000 per year with a service-level agreement that covers data collection, data freshness, data reporting, a higher data processing limit, and access to dedicated support specialists.
The cost of AA can start at $100,000 depending on how many hits you receive each year. There is no free version of the solution available, but there are three different packaging solutions depending on your needs and usage.
Winner: Generally, only large firms will use GA360 and AA, so it depends on the usage and individual organizations’ needs. Therefore, we have a tie. For SMEs, however, there is a clear win for GA4.
9. Data Retention
While GA4 only stores customer data up to 14 months and GA360 up to 50 months, AA provides lifelong customer data storage. Additionally, AA can store cookies for approximately 15 years, whereas GA can only keep them for a month. This implies that organizations can concentrate on their clients for longer periods of time by using AA.
Winner: There is no doubt as to AA being the clear winner here.
10. Integration
AA can be integrated with Adobe Target for A/B testing and Advertising Cloud for ads integration. Adobe Campaign, Customer Journey Analytics and Adobe Experience Manager are other examples of AA integrations. Although manual data upload is possible using FTP protocols, it takes some effort to define the estimated metrics and determine the campaign's ROI. Additionally, Adobe provides a variety of data connectors that let you import tracking data from external programs into analytics so that you may collect and analyze data from a single central location.
On the other hand, GA integrates with Google Optimize for A/B testing. GA may be integrated with other Google stack products like Google Ads or BigQuery. For consolidated CRM data, you can also integrate Salesforce and other third-party CRM tools with Google Analytics.
Winner: In this case, the choice depends on which tools you want to integrate. If these tools are mostly advertising tools, then GA would be better. If you want to integrate with more performance-based tools like A/B testing, heat map tools, etc., then AA is the best option.
In a Nutshell: The right tool for the right company at the right time
Choosing the ideal tool is not an easy task. It heavily depends on your business goals, the level of insights you are seeking, your budget, the other tools you use, and your analytics’ team effectiveness.
If you ask our expert opinion, GA4 is best for small businesses and startups searching to conduct a free and accurate analysis of their website on their own. However, AA is a better choice for firms that are prepared to invest in advanced e-commerce and technical analytics.
Which web analytics tool do you use, and why?
Any questions? Contact lisanza.faccilongo@keyrus.com
