It was end of August when a colleague reached out to me saying that there is a new project in the pipeline that I might be interested in. It turned out that the project was for a new client, so I didn’t have to think much before accepting. This project was indeed the perfect opportunity for me to build something from scratch and learn new things.
Long story short, the client was planning to launch a mobile payment solution for its B2B customers. Since the project was in the pipeline for some time already, at the moment we joined the project, they already had a pretty clear view on what were the technical options available for the roll-out. However, the client was unsure of the impact of these options on their business, as well as which one was the best from a business point of view. Therefore, we suggested a data visualization solution to answer these questions.

In order to make a success out of this project, it was crucial to us to know more about the client and the project it was undertaking. Unsurprisingly, the best way to achieve this is by meeting people and discussing about the project, the business and data available. This part of a project is extremely valuable for two reasons: on one hand you get insights that help you deliver a useful solution for the final users, and on the other hand you meet new people and learn a lot on a personal level. And in my opinion, this is what makes the consultant job really interesting.
Moreover, after digging up a bit into the initial ideas, we concluded that the client was mainly interested into an overview of its physical assets (sites) that combined geographical, technological and transaction information. In particular, the client wanted to:
Identify countries where to first implement the mobile payment solution
Identify customers for the early roll-out of the mobile payment solution
Analyse the data for asset management purposes
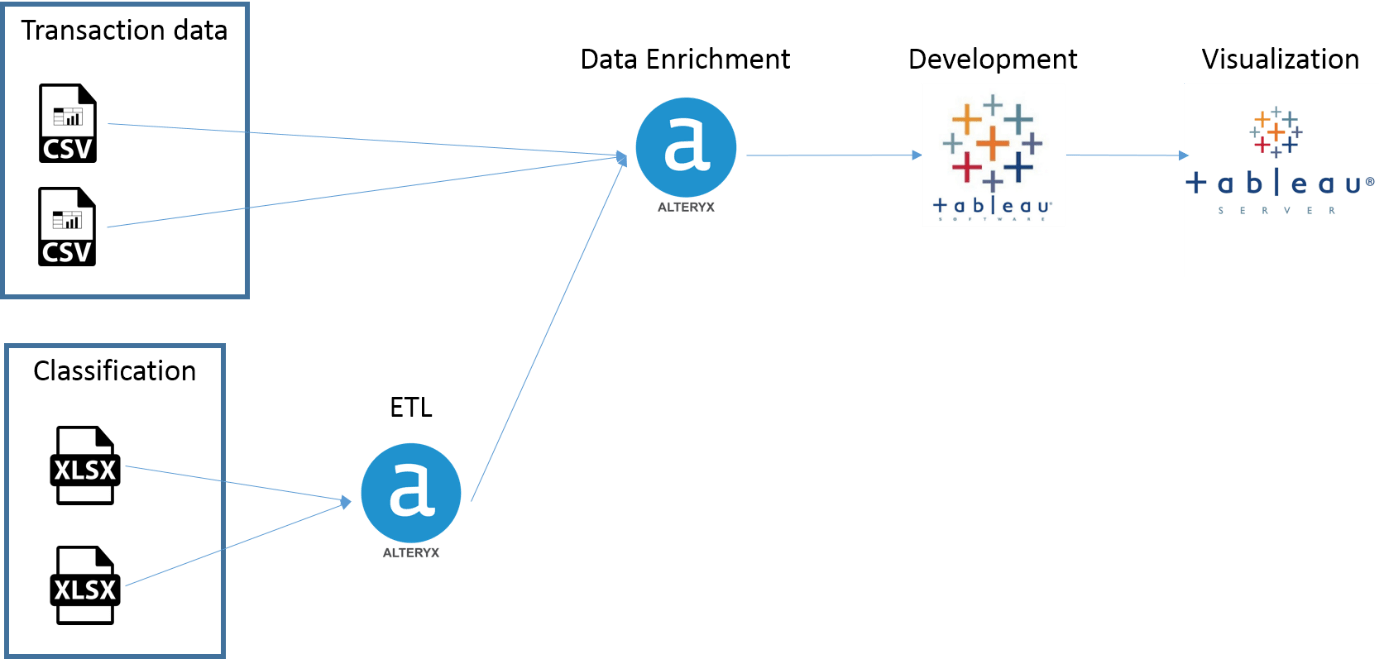
To answer these questions we had at our disposal non-aggregated structured transaction data from the back-office, as well as different excel files with data about the sites and customers (identifiers, names, classifications…).

The biggest challenge during this project was making sure to have reliable and clean data about the sites (physical assets) and customers. Indeed, since transaction data was coming from a reliable source, there were no particular issues with it. However, information about sites and customers originated from multiple sources for which there was no thorough maintenance. Therefore, we started preparing the data by using Alteryx and by meeting with the client to discuss data issues and assumptions to be made. After, a couple of such sessions, we managed to create several reference files for the data that we needed about the sites and clients. Allowing us to move onto the last stage which was data visualization.
For this stage, we used Tableau to create dashboards that the client could use to explore its data and find answers. Self-service data visualization is an interesting approach for two reasons. On one hand, the developer doesn’t have to have all the business knowledge required to interpret results, thus accelerating the delivery of results. And on the other hand, users can explore data with very little technical knowledge about the tool, while having a business background that allows for meaningful data interpretation. In this particular case, we created several dashboards that combined both charts and geographical maps in order to help the users find answers to the initial questions.

The initial project is now over but this isn’t however the end of the story. Through this exercise, we successfully raised data awareness and sparked the interest of other teams for data analytics. Which, at the end of the day, might be the most rewarding aspect of any project!
Any questions? Don’t hesitate to contact me: alexandru.bostan@keyrus.com
