Leveraging customer data to understand their behaviour, preferences and motivations can lead to significant return on marketing investments. However, with large numbers of customers and transactions, traditional business intelligence practice is to reduce customer data down to aggregated metrics, typically focussed on pre-defined segments (or cohorts) of the customer base. Whilst useful, this process discards some insight that can be revealed only by looking at individual customer-level records. In this blog, we discover a way to use Qlik Sense's On-Demand App Generation to study user-defined customer cohorts.
One of our clients has millions of customers across the globe, and we have helped their marketing team to build an analytics platform in Qlik Sense to keep track of all customer activity, serving more than 400 monthly active users within the organisation.
With millions of customers and transactions to analyse, applications and dashboards are typically built from pre-aggregated datasets. This is necessary in order to minimise the volume of data and maximise dashboard responsiveness for the business user. However, information and insights about customer behaviour are inevitably lost during this aggregation.
These dashboards are excellent for tracking high-level metrics and answering simple questions such as 'how many customers purchased product X in November?'. However, marketing analysts often want to gain a deeper understanding of their customers than this. They ask follow-up questions such as 'what other products did those customers buy in the same month?'.
It's a simple question, however the data aggregation has removed purchase-level information without which an answer is not possible. In this instance, loading all customer-product purchase records into the dashboard is not possible due to the size of dataset.
Instead, the business user would typically contact a data team who would write and run a bespoke query in order to get the answer. Depending on the organisation's structure and processes, this can take considerable time and resource. Regardless, it feels like something that the user ought to be able to self-serve in some way.
Looking back at the hypothetical questions above, the user doesn't need to analyse all customer-product purchases, only those involving product X during a single month. An efficient method to answering the query would be
Define the scope of customers 'the cohort' that they are interested in (purchasers of product X during November)
Retrieve customer-product purchase records for just those customers
Perform some analysis on this subset of the total customer base
Qlik Sense provides a self-service means of automating this process, using a feature called on-demand app generation (ODAG).

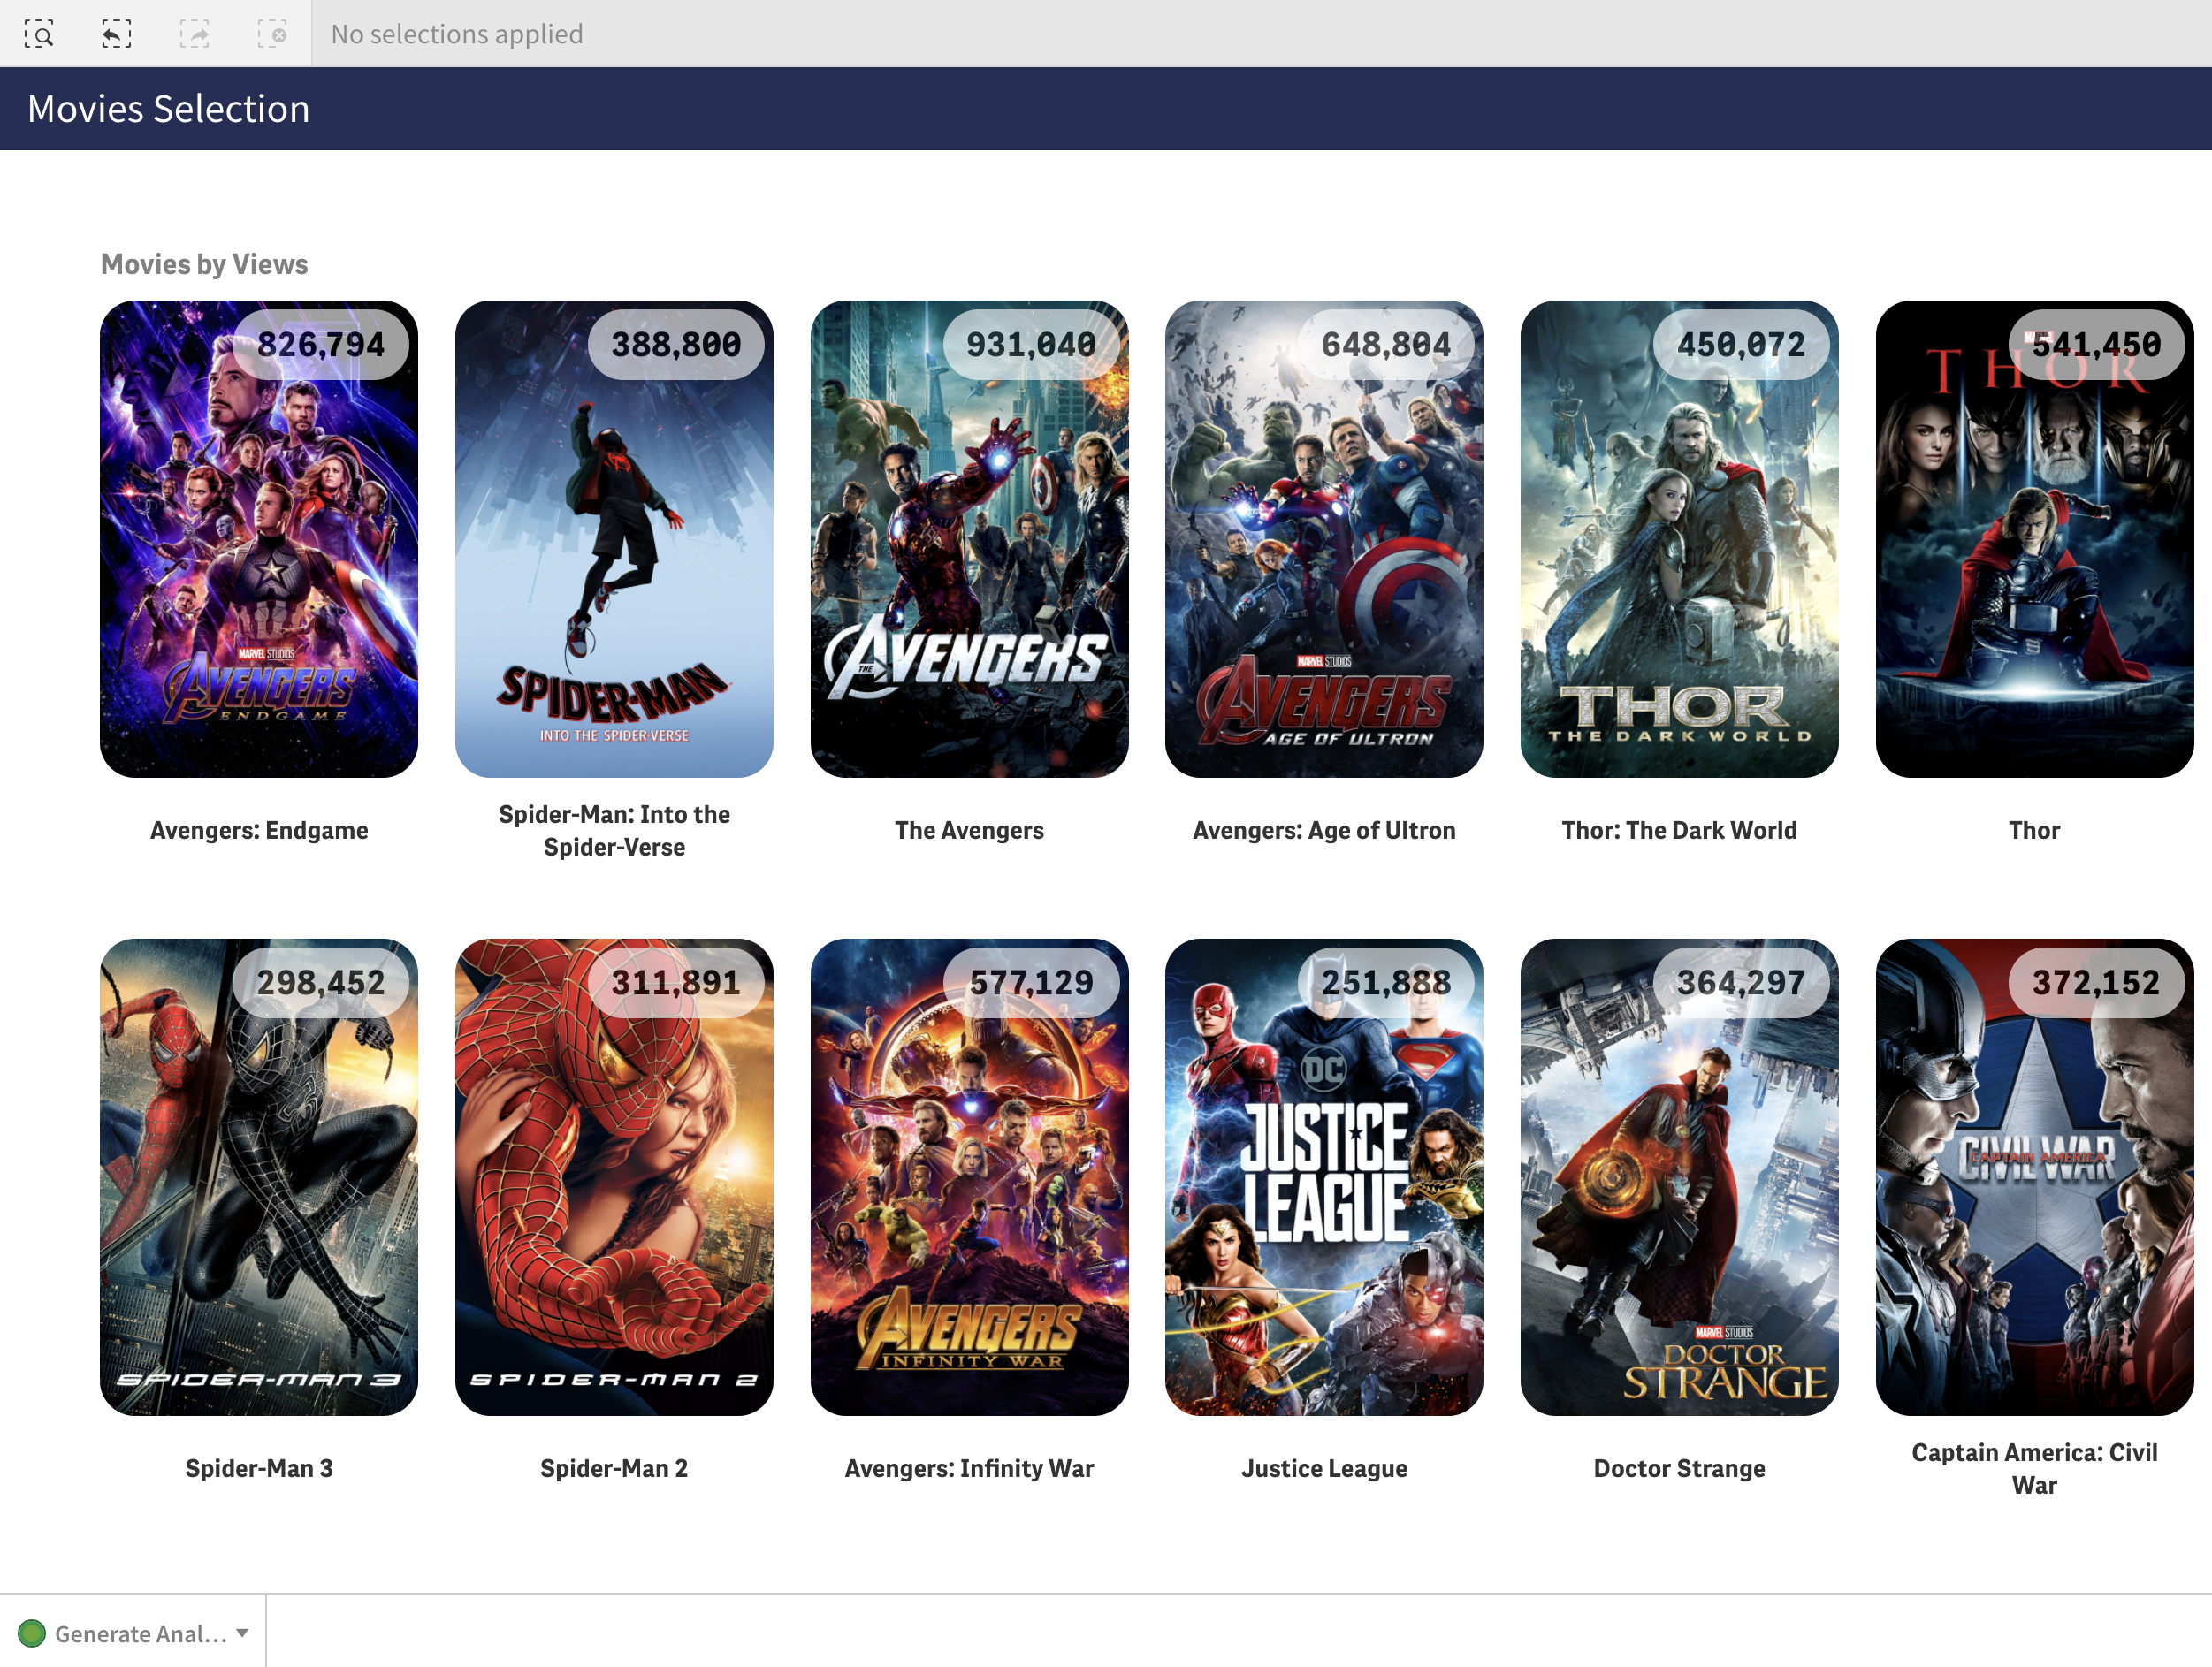
Figure 1: An example Selection App showing a simple user interface to select a single product (Movie). In the bottom-left is a button to generate a new app. Dummy data is used for purposes of demonstration.
ODAG involves developing and deploying two Qlik Apps. The first, known as the selection app, allows the user to select their domain of interest. It should consist of a series of relevant dimensions from which the user can make selections. Figure 1 shows an example selection app using some dummy movie data. In this case, suppose that the user wants to know what other movies have been watched by customers that watched Interstellar.
Our user would first navigate to this app and select their movie of interest. They would then use an app navigation link button at the bottom of the app to generate a brand-new app based on their selections.
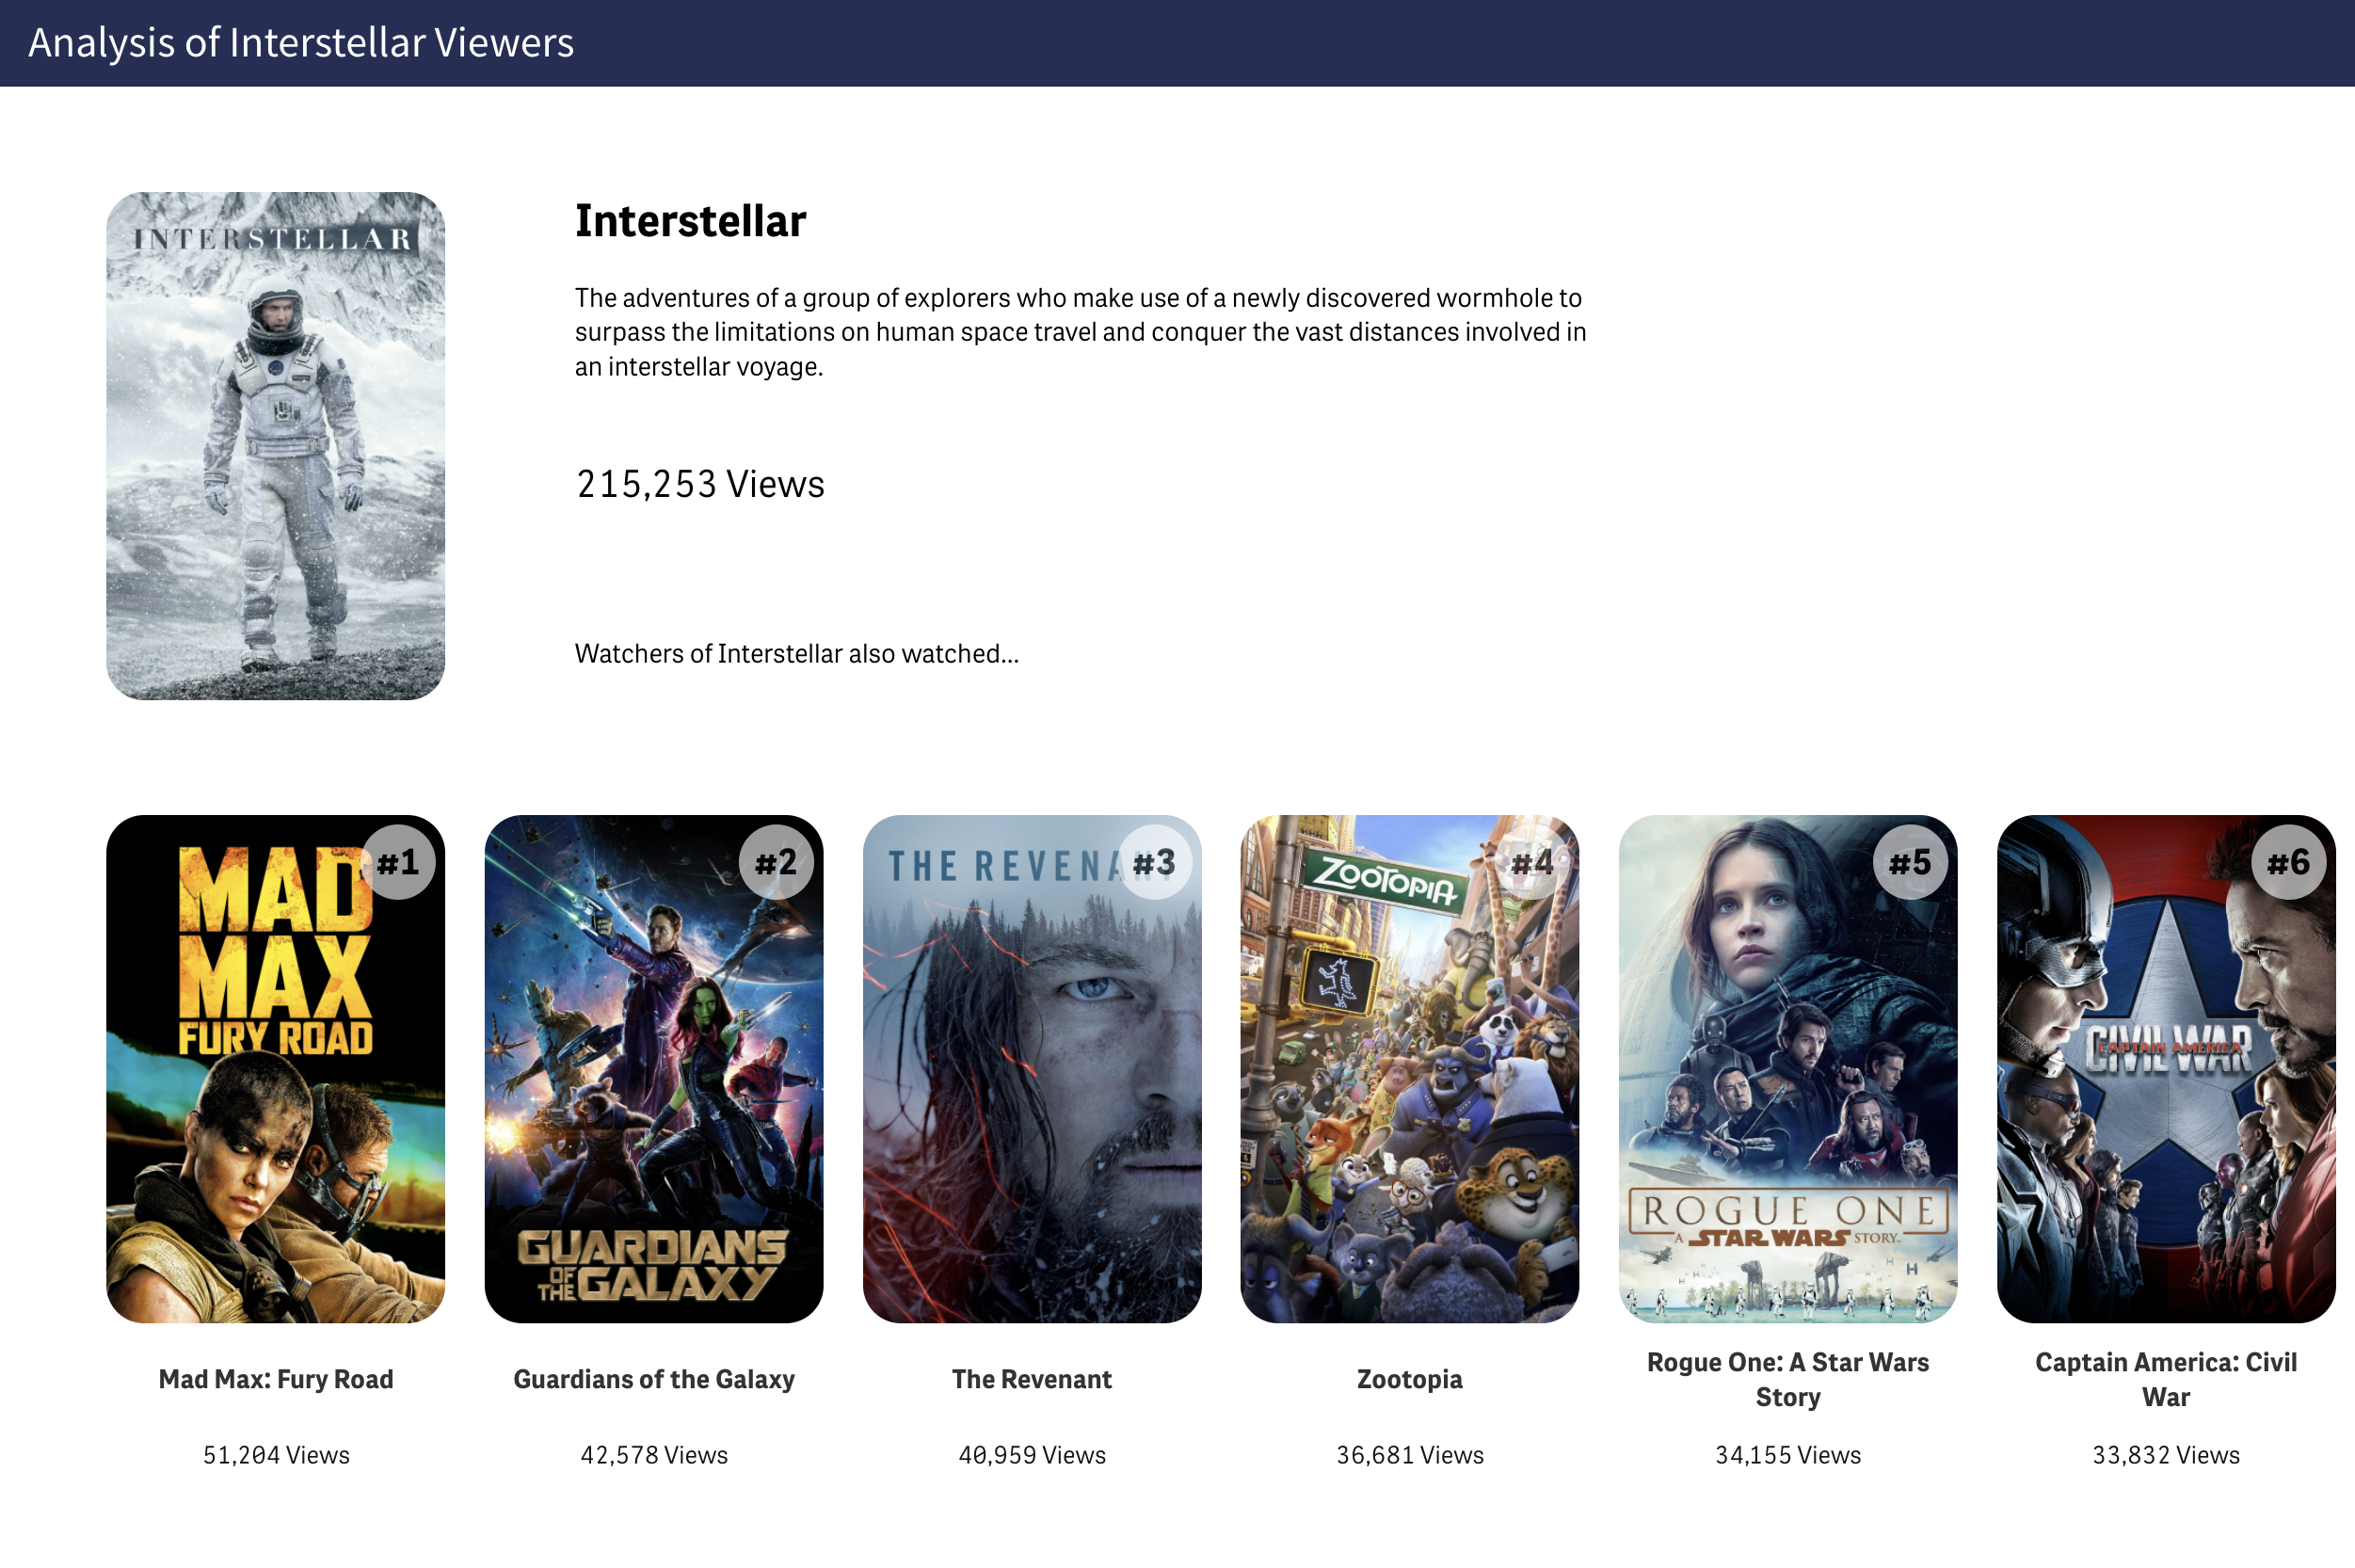
The content of this new app is determined by a template. The load script for the template app contains placeholders for user-selected dimension values to be substituted into. Aside from this it can be built just like any other Qlik app. An example of this is shown in Figure 2, which depicts the top 6 movies that were also watched by watchers of Interstellar. Without ODAG, this basic analysis would only be possible by loading rows for every single movie viewing, which is not practical when the number of views is very large (in the hundreds of millions).
In summary, the end-to-end process for ODAG is as follows:
User makes selection in Selection App
Clicks Generate App button
A copy of the Template App is created (in their workspace by default)
Placeholders within the load script are replaced by user selected values
The newly generated app is refreshed
A link to open the new app appears within the Selection App
On-demand app generation is a great tool that allows Qlik users to access high-level metrics efficiently using aggregated data yet simultaneously retain the ability to drill into the detail by generating their own app when required. This is a particularly good solution when the vast majority of users only need to see a high-level view but some users will occasionally need to see detail.

Figure 2: An example of a generated app using the selection made in the selection app. The analysis has been done using only the customers that had watched Interstellar.
Another use case for this might be a finance dashboard that shows a weekly or monthly summary yet allows the user to see individual transactions using ODAG.
The result of adding ODAG to our clients toolkit is that the business user is now empowered to self-serve insights about multiple segments (or cohorts) of their customers. Queries that previously required help from a data team and potentially weeks to be completed can now be answered with a few clicks and just minutes waiting for the output. This means that the marketing department can make data-driven decisions much quicker at both a global and local level, and the data team is left with more time to focus on other priorities. It's a great example of self-serve analytics in which everyone wins.
If you're working with Qlik and want to know more about using ODAG to gain deeper insights please get in touch, we would love to help you.
