At Keyrus, we have the opportunity to engage in “offline tasks.” An offline task allows you to work on a project that incorporates skills or technologies you don’t use in your day to day work. As a consultant, I had never done anything related to data science before. I wanted to see what the buzz was about, and how I could increase my skill set with some new tools.
I decided I would extract Twitter feed data about any business intelligence or ETL tool and perform a sentiment analysis on that data. The benefits were twofold: I could dabble with data science concepts, and also gain some insight into how some of the tools compare to one another on Twitter.
Roughly 500 million tweets are posted by people every day, which translates to a rate of 6,000 tweets per second. Some companies utilize this as a source of customer thoughts and opinions, but it mostly remains an untapped mine of insight. This is where a sentiment analysis comes into play. It can help businesses answer questions like:
How do customers feel about my company?
Did that last marketing campaign we launched have any effect on how our newest product is viewed?
How many tweets referred to us in the last two weeks?
Answering these types of questions can produce serious value for a business. The solution here is to extract all of these tweets, analyze them to find those sentiments, and then have a way to visually explore them and isolate the insights.
The Project
The purpose of this project was to create a parameterizable process that could extract Twitter feed data about any business intelligence or ETL tool and perform sentiment analysis on that data. We could then use this analysis to study and react to the sentiment of Twitter users who are tweeting about these data tools.
The tools and services that were used in this project are:
Twitter API: used to create an app that Alteryx can extract the data from.
Alteryx: used to extract and transform the data (including performing sentiment analysis).
R: used within Alteryx to perform sentiment analysis on the Twitter data.
Microsoft SQL Server: used to store and host the data.
Tableau: used to visualize and analyze the sentiment of the Twitter data.
Twitter API
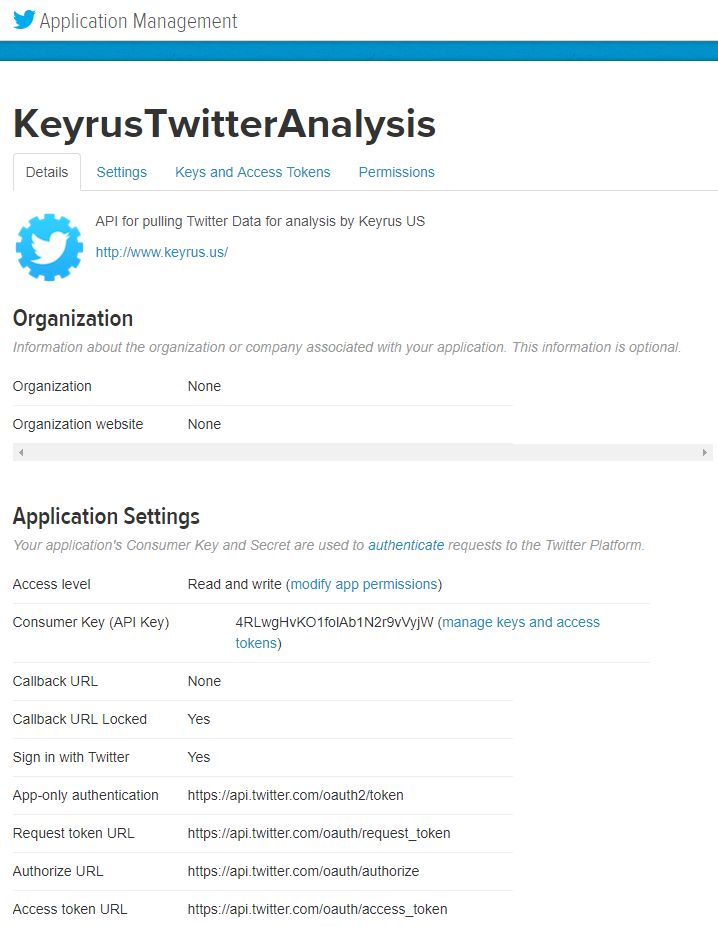
In order to extract the Twitter feed data, you need to create a Twitter API. The first step is to create a Twitter account (preferably just for this project). Next navigate to https://apps.twitter.com/ to create the API app (the one used for this project is shown below). Fill in the application details and hit “create your Twitter application.”
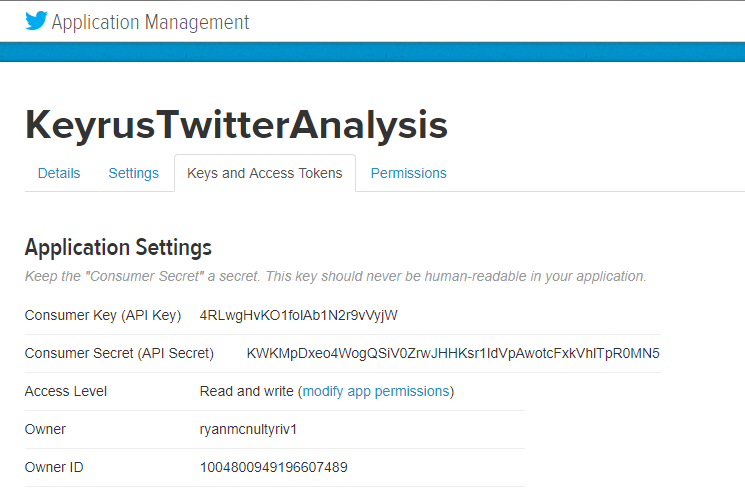
After creating the app, take note of the Consumer Key and Consumer Secret under “Application Settings” in the “Keys and Access Tokens Tab.”
Alteryx
The Workflow/Analytic App created for this project is called “Twitter_Sentiment_Analysis_Data_Tools.”
Twitter search tool
The first Alteryx component of this workflow is the Twitter Search Tool (Note: this tool may not come pre-installed with Alteryx. Add it from the Alteryx Gallery).
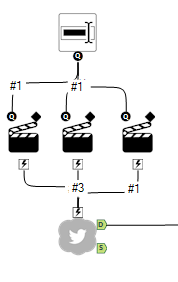
In the “Configuration” tab of the Twitter Search Tool, enter the Consumer Key and Consumer Secret as well as the Application Name chosen when the API was created. To edit the search parameters of the tool, click the “Search” tab.
When this Alteryx Workflow is run as an Analytic App, the user will be prompted for what business intelligence or ETL tool they would like to search Twitter for. The app can be run as Analytic App by selecting the “Magic Wand” icon next to the standard green arrow execute button in the top menu.

Data Cleaning
To prepare the data for NLP (Natural Language Processing) and sentiment analysis, you need to clean the data extracted by the Twitter Search tool.
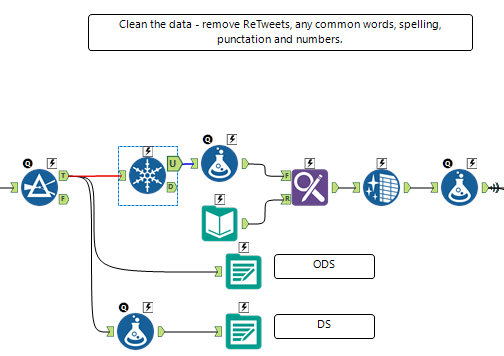
The steps above filter out Retweets, any non-unique tweets, and removes any common English words from the TweetBody field.
Sentiment Analysis
The sentiment analysis for this project is done using the R library “tidytext” (not a library that comes pre-installed with Alteryx’s Predictive R toolset). The code gets the sentiment lexicons called “afinn,” “nrc,” and “bing.”
Afinn: For the words in its lexicon, it provides a score between -5 (negative) and 5 (positive)
NRC: For the words in its lexicon, it provides a specific sentiment (positive, trust, joy, negative, fear, etc.).
Bing: For the words in its lexicon, it provides a binary sentiment rating (positive or negative).
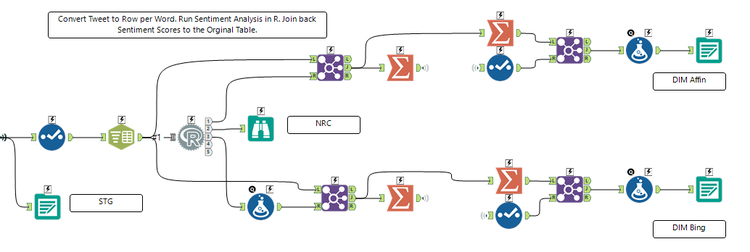
In order to use these lexicons, that data had to be converted to a single row per word (unigrams) using the Text to Columns tool.
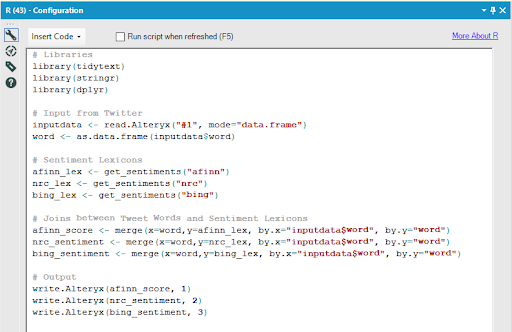
The R code used in this project can be seen below as it is entered into the Alteryx R developer tool. The code imports the necessary libraries, the inputs from the Alteryx workflow, and the sentiment lexicons.
Then the code joins the lexicons onto the inputted Twitter data so that each word-score in the lexicons library gets attached to the feed data. Each of these joined tables are outputted to the Alteryx Workflow.
The last steps in this part of the workflow aggregate the scores back up to the per Tweet level of granularity and then those aggregated tables are joined back onto the main Twitter data table. Two dimensional tables for the Afinn lexicon and Bing lexicon Twitter tables are created in this stage as well.
Load to DWH
The final part of the Alteryx Workflow is joining the main Twitter data table to the Afinn sentiment score table and the Bing Score table, and then preparing that data to flow in the fact table in the SQL Server.
The majority of the tools in this part of the workflow deal with converting the Twitter TweetPostedTime to a readable date format, as the Twitter API outputs a string format for that field.
Finally, the data is sent to the local database “DB_Twitter_Sentiment,” hosted on the local machine for this project.

SQL Server
For this project, a local SQL Server instance ((LocalDb)\TwitterSentiment) was set up with a local database (DB_Twitter_Sentiment). The schemas for this database are: ods, ds, stg, dwh. The tables created and populated by the Alteryx workflow are:
ods.twitter_sentiment: incremental load table per tweet
ds.ds_twitter_sentiment: historical table of ods per tweet
Keys: TweetID
stg.stage_twitter_sentiment: incremental stage table per tweet
dwh.fact_twitter_sentiment: historical fact table per tweet
Keys: TweetID
dwh.dim_twitter_sentiment_afinn: dimension table for afinn score per word
dwh.dim_twitter_sentiment_bing: dimension table for bing score per word
dwh.view_twitter_sentiment: view that unions all fact and dim tables
Tableau
For Tableau analysis, I created two dashboards: Sentiment Analysis and Sentiment Comparison.
Sentiment analysis dashboard
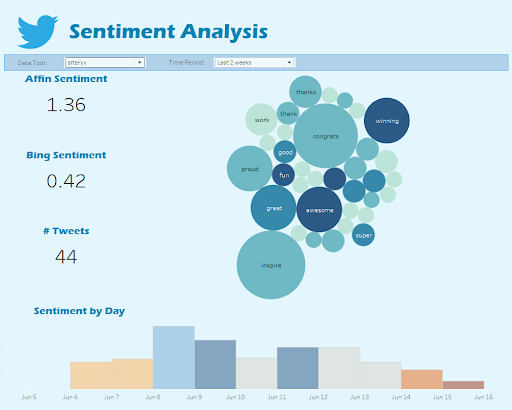
The purpose of this dashboard is to provide an overall analysis of the Sentiment of the Data tool specified by the filter in the top bar.
The three KPI’s on the left display the overall Affin Sentiment Score, the Bing Sentiment score, and the number of tweets that are being considered.
The packed bubble chart contains the sentiment words used in the tweets – their size correlates to how often they were used in relation to that data tool, while coloring is based on the sentiment scores. (Note: Time period filter does not affect this graphic).
The Sentiment by Day chart at the bottom displays the average Affin sentiment by day and is colored by the average Bing sentiment score. (Note: Two days can have similar Affin scores, but are colored differently because the Bing score may have rated a word differently, since it is on a binary scale).
Sentiment comparison dashboard
The purpose of the Sentiment Comparison Dashboard is to compare two of the data tools that have had data pulled by the Alteryx Workflow. In the dashboard below, Tableau and Microsoft’s PowerBI are compared via the sentiment scores.
The KPI’s (the same from the Sentiment Analysis Dashboard) allow a quick glance to see how each BI software is performing on Twitter.
The tables at the bottom display the average Affin and Bing scores per day, allowing for some quick trend analysis for each tool. (Note: the time period for these charts is selected from the filter on the Sentiment Analysis Dashboard).
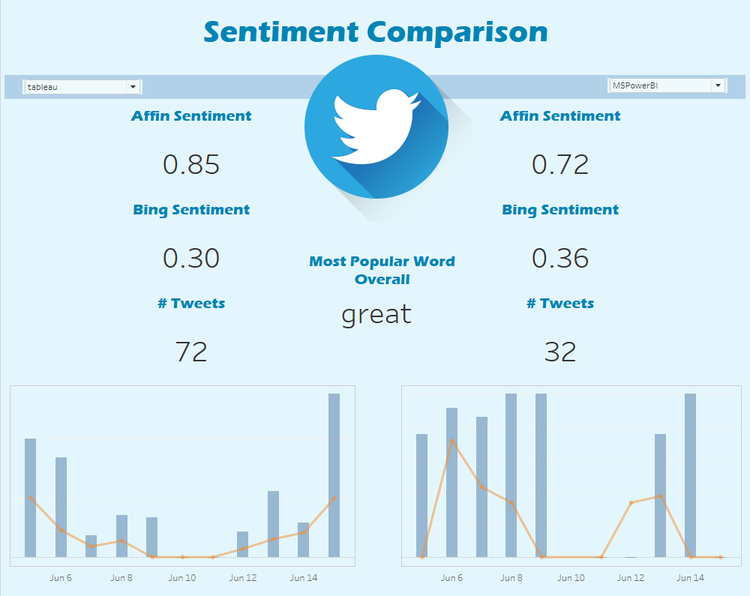
The Tableau visualizations above allow for rapid insights into these BI tools. We can see that Tableau’s efforts to engage with customers on Twitter have a high correlation with a more positive sentiment of their product.
In just a week’s time and the right tools, I was able to enhance my understanding of the business intelligence tool space and analyze user sentiment. This type of project would be invaluable to any business seeking a greater understanding of their customers.
