If you’re familiar with Tableau Desktop, you already know that Tableau can instantly geocode most major cities and turn them into rich interactive maps. However, addresses that are more granular than municipality (i.e., street level data) require both longitude and latitude in order for Tableau to correctly map them.
This post walks through the process of creating and integrating a python script with Tableau Prep. The script geocodes a list of addresses to longitude and latitude values using Google Maps Geocoding API. The end result is a fully automated process (all within Tableau) that allows you to visualize address level data.
This automation is possible thanks to Tableau Prep Builder 2019.3 One of the most exciting features in this release is Tableau Prep’s new ability to integrate with R and Python. This feature enables users to transform their data (add additional rows, create rankings, utilize row level calculations, etc.), take advantage of data science workflows, enrich data with third-party APIs, and so much more!
Let’s explore how we would use Tableau Prep Builder to retrieve geographic information from a Google API based on a list of addresses.
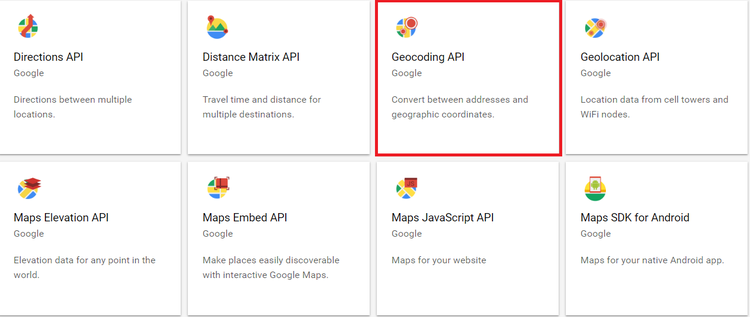
Geocoding API
The Google Geocoding API is a service that provides address geocoding. In other words, you feed it with an address and get the longitude and latitude for that location. A Google billing account is required to use Google Maps Platform APIs and SDKs. Try getting started here. Follow the instructions and generate a Google API key. Later, you’ll need to insert this kay into the Python script. It may be useful to use the free quota of API calls to test this out.
Input Data
The sample data used in this exercise contains all Starbucks addresses in the United States. The sample addresses can be found in this repository. Using other Tableau Prep steps, I’ve done some data cleansing and parsing before feeding the data into the script for improved accuracy.


Script Setup
The sample script is available under the file named “Geocoding.py” in the same repository as the input data. Open up the script in any editor and simply insert the unique API key generated earlier into the quotation mark for the API_key variable. Save the file, and the script is ready to run.

Understanding the Script Logic
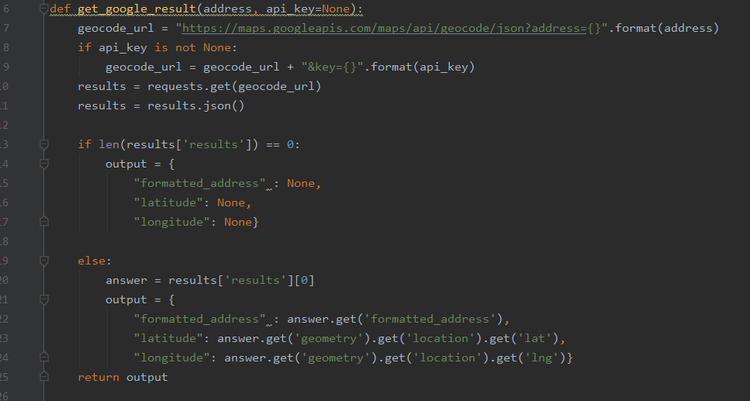
The script contains two functions. The first function ‘get_google_result()’ creates an API call with an input address and retrieves the geographic information via the API. The information being saved are the longitude and latitude values. The full JSON response contains additional information about the addresses. Modifying the script allows you to save more information as needed.
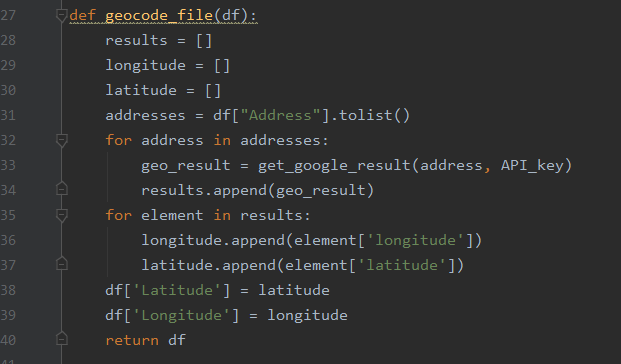
The second function ‘geocode_file()’ enables batch geocoding. This function reads in a data frame (a data type that is similar to a table), takes a column of addresses, and applies the first function to every single address in the list. This function outputs a data frame with added longitude and latitude values in separate columns.
TabPy Setup
TabPy is the Tableau Python server that allows users to execute Python scripts via Tableau or Tableau Prep. Visit TabPy for more information. I would recommend initiating the TabPy server by running the startup file from TabPy before diving into Tableau Prep.
Add the Script to Tableau Prep
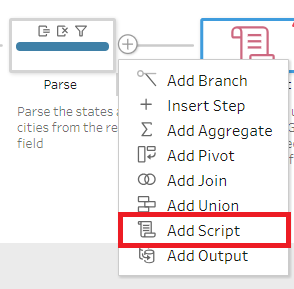
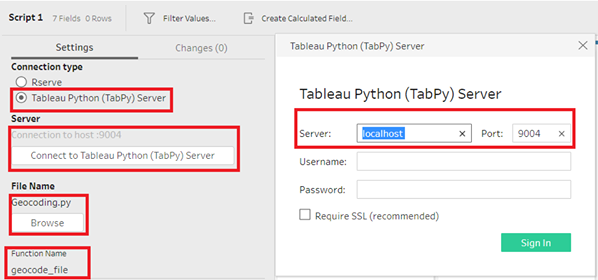
Starting in Tableau Prep 2019.3, users are able to add a script step to a flow. Select “Add Script” from the menu and configure the connection. Connect to TabPy, browse to the saved Python script file, and enter the function name.
Output Data
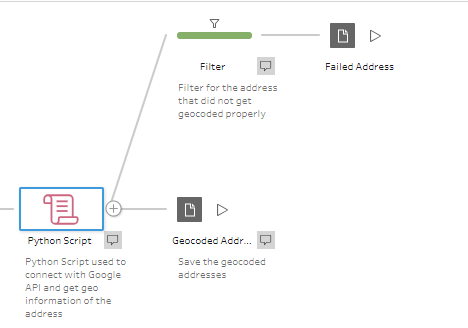
There are two output files generated from the flow:
The primary file is saved as a Tableau extract. This file contains the processed addresses and is ready to be visualized in Tableau Desktop.
The second file is saved as a .csv file. The .csv contains addresses that fail to retrieve longitude and latitude values. Using this file allows for viewing and revising of failed addresses. Essentially it allows you to better clean your source data and make sure your addresses are properly recorded in your systems.
The following screenshot is an example of the primary data output:

You can now open up Tableau Desktop and analyze your data address level data using Tableau maps. Check out this example dashboard to see how we leveraged this output data.
Conclusion
This exercise is simple yet inspiring. A lot more can be done now that Tableau Prep integrates with Python and R. The dashboard below illustrates how precisely Tableau can map locations, such as these Starbucks stores, with acquired geographic information.
